One of the hallmarks of a mature language is the ability to do live remote debugging. Java has this capability.
Scenario: you have a web application running on Tomcat or a console application that you want debug remotely. In this scenario I will be using Eclipse and connecting to the server using SSH tunnel. With SSH tunnel you can debug as long as you can SSH to the server, regardless of if there is any firewall in between (e.g. AWS security group).
These are the settings to use on the Java executable on the remote side.
-agentlib:jdwp=transport=dt_socket,address=1043,server=y,suspend=nApplication is a SpringBoot application or a regular Java console application
java -agentlib:jdwp=transport=dt_socket,address=1043,server=y,suspend=n -jar ...Example
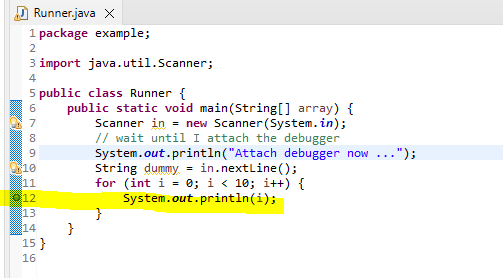
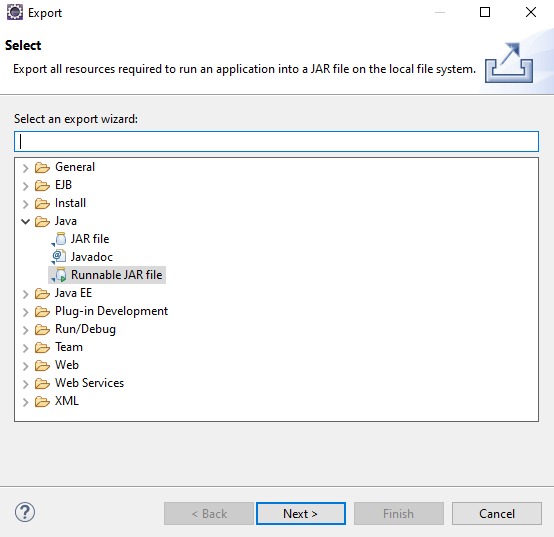
In Eclipse, create a Runnable jar by right clicking on the project then choose Export
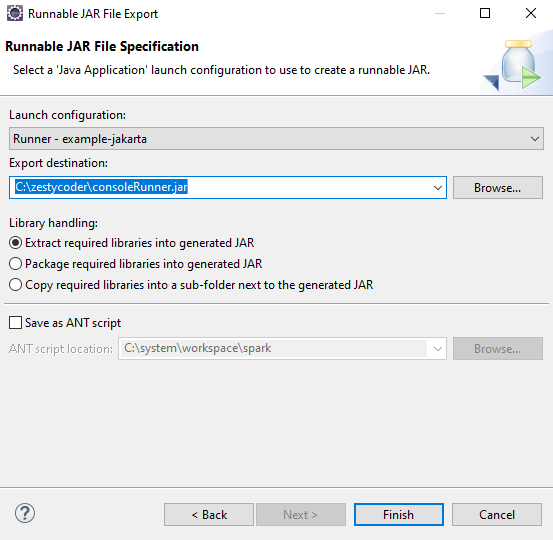
Copy the jar file to the server.
On the server run this
root@ip-10-8-8-62:~# /system/jdk/bin/java -agentlib:jdwp=transport=dt_socket,address=1043,server=y,suspend=n -jar consoleRunner.jar
Listening for transport dt_socket at address: 1043
Attach debugger now ...
Make sure it is listening on port 1043
root@ip-10-8-8-62:~# netstat -nutap|grep 1043
tcp        0      0 127.0.0.1:1043          0.0.0.0:*               LISTEN      43191/java
In Putty, setup an SSH tunnel
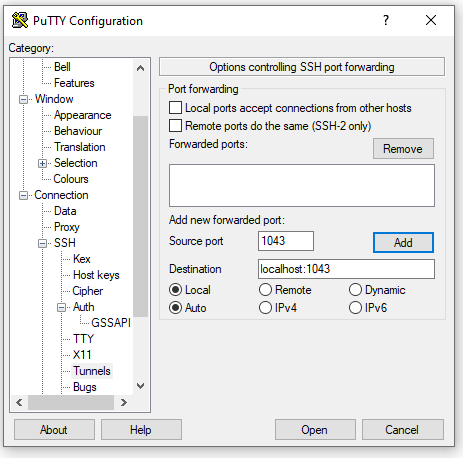
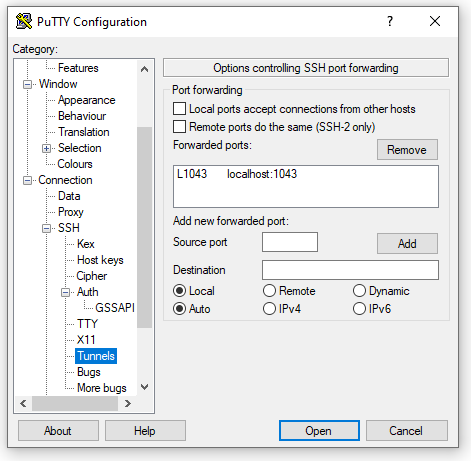
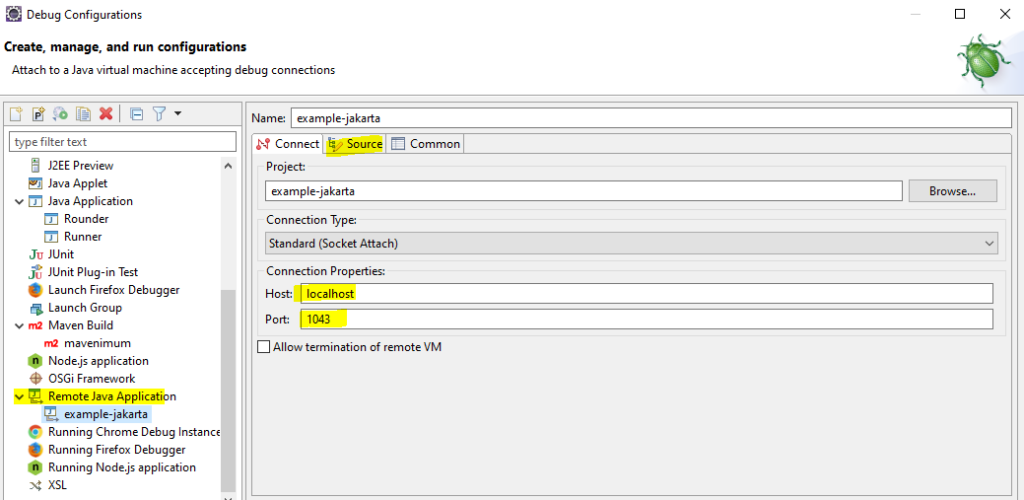
On SSH connection is established. In Eclipse, start a remote debugging session. Go to Remote Java Application. Check the Source tab to make sure Eclipse knows which source code you are debugging. On Connection Properties specify localhost (since we are using a SSH tunnel) and port 1043 (the tunnel source port).
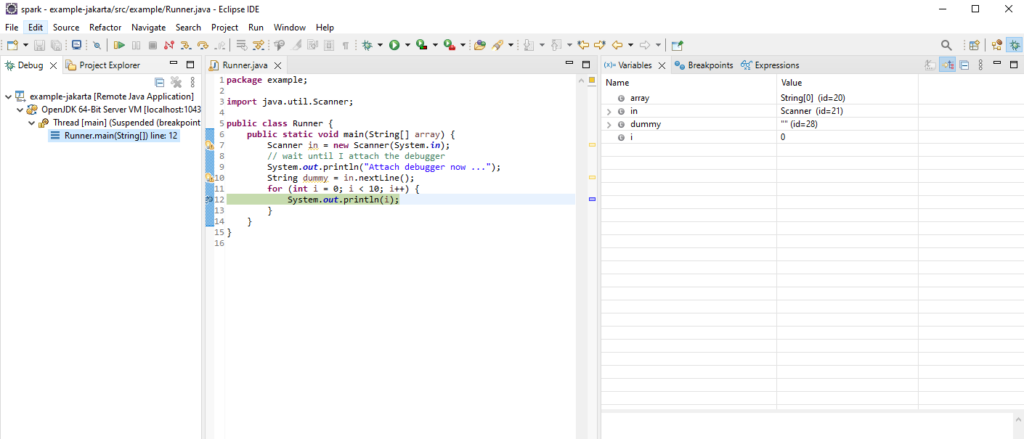
Application is a web application running on Apache Tomcat
Use CATALINA_OPTS to specify our settings (it might be possible to use JPDA_OPTS also)
CATALINA_OPTS="-agentlib:jdwp=transport=dt_socket,address=1043,server=y,suspend=n" /system/server/tomcat/bin/startup.shMake sure it is indeed listening on port 1043
root@ip-10-8-8-62:~# netstat -nutap|grep 1043
tcp        0      0 127.0.0.1:1043          0.0.0.0:*               LISTEN      43217/java
Attach the Eclipse debugger using SSH tunnel as described above.

This is the class that I want to debug. I’ve added my breakpoint on line 16.
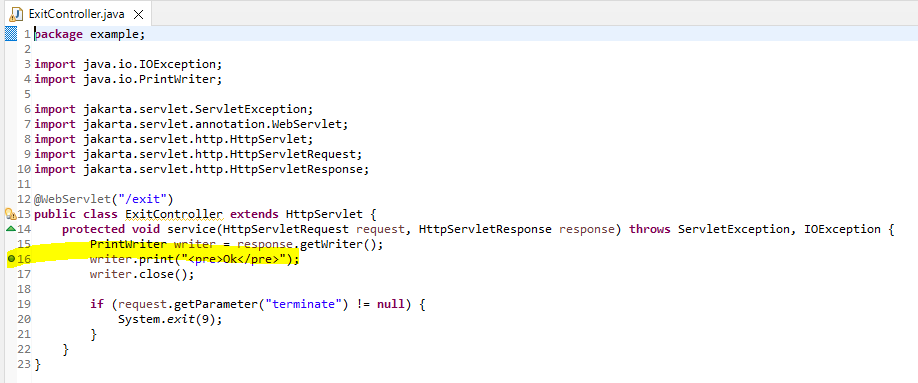
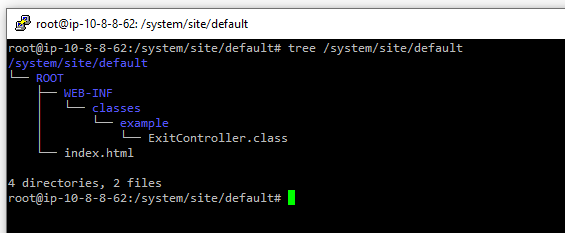
You need to deploy this application to the server, here I am using Tomcat. And since this is simple Servlet based application, I can get away just by copying this 1 class file only (instead of full blown folder or a war file).
In the browser, do a HTTP GET on the exit controller.

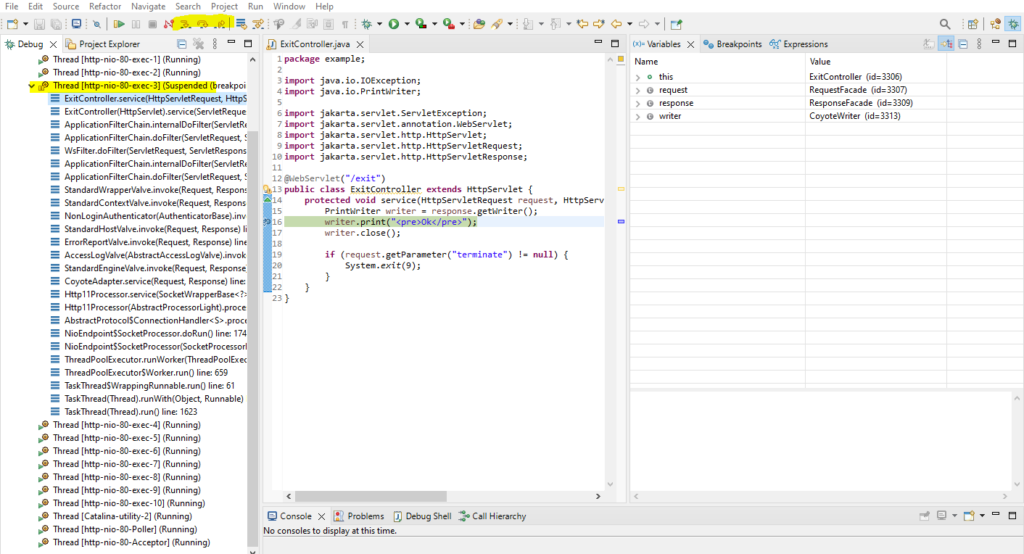
Happy debugging.
Note:
In this guide, Tomcat/application listens and wait for debugger to be attached. Another method is for Tomcat/application to attach to a running/listening debugger. Full documentation for Java SDK 20 is https://docs.oracle.com/en/java/javase/20/docs/specs/jpda/conninv.html.